80/20 Principle – The principle with ever increasing use cases

With the innumerable opportunities to get diverted from what is relevant, I have seen many successful and not that successful organizations, teams and individuals working very hard on the irrevelant and getting buried there. The 80/20 principle or the Pareto Principle is for those who are willing to pause a while before jumping into action. Though many have written about Pareto principle and analysis before, I thought of writing this blog post for the benefit of many who plunge into action on irrelevant projects, indicators than on the relevant ones. There is time for everything, if we can prioritize, eliminate, delegate and decide on the mosr relevant work we ahould be doing.

Pareto Principle or the 80/20 Principle

The 80/20 principle or the Pareto Principle by Vilfredo Pareto in the year 1896 is the one which is always heard in all walks of life, time and again even after a century of its discovery. Last week I heard it in our senior management review when one of the senior managers used 80/20 to highlight the need to focus on the 20% of the customers contributing to 80% of the revenues. The use cases of 80:20 or the pareto principle is innumerable. Here are some;

  • By eliminating 20% of the root causes we can eliminate 80% of the defects in a product
  • 20% of the customers contribute to 80% of the revenue. It makes sense to focus on this 20% of the customers.
  • 80% of the customers uses 20% of the features of the products. The remaining 80% of the features are used only by 20% of the customers.
  • By focusing on 20% of the project health indicators proactively, 80% of the problems can be eliminated / prevented.
  • 20% of unhealthy practices contribute to 80% of the productivity loss. By controlling this 20% percentage of unhealthy practices, productivity can be improved phenominally.
  • 20% of the workforce does 80% of the work. Remaining 80% does only 20% of the work
  • 20% of the work we do produces 80% of the results. The remaining 80% of the work produces only 20% of the results.
  • During 20% of our worktime, we complete 80% of our work. During the remaining 80% of our work time, we complete only 20% of work.
  • Only 20% of the projects yield the desired results, 80% of the projects do not yield desired results.

Pareto analysis

Here are the steps involved in performing Pareto Analysis;

  • Identify the probable rootcauses – The best ways to do this is to brainstorm with the team to identify potential rootcauses leading to the situation. Ishikawa diagram or the Fishbone diagram can help to do structured brainstorming to arrive at the potential root causes.
  • Frequency of occurrence – With the help of data, identify how many times each rootcause occurred, resulting in the outcome.
  • Order on frequency – List the root causes based on the frequency of their occurrenece (in the descending order)
  • Prioritize and take action – Identify the 20% of root causes contributing to the 80% of occurrences. By controlling these 20% of the root causes, 80% of the problems can be eliminated.

80/20 at a personal level

Can be effectively used at a personal level to;

  • Eliminate unproductive activities
  • Focus on strengths
  • Finding time to work on Important and not urgent projects

Project Cost and Schedule forecasting

Schedule and Cost forecasting explained in detail.

  • Are we progressing as planned?
  • Are we completing the work within budget?
  • When will we complete the project?

These are the key questions we hear most of the time in project review meetings. Well implemented earned value management systems, provide answers to these questions at the press of a button.

Earned Value Management (EVM) is based on the analysis of the earned value of the project and comparing it with the planned value of the project. Earned value management is used to monitor and control both the schedule and cost. Earned value management (EVM) comprises of;

  1. Earned Value Analysis
  2. Variance Analysis
  3. Trend Analysis
  4. Reserve Analysis
  5. Corrective / Preventive actions
1. Earned Value Analysis :

The basic building blocks of earned value management are;

  • As on date, how much work we were supposed to complete? – Planned Value (PV)  – Also known as Budgeted Cost of Work Scheduled (BCWS) 
  • Out of that how much work did we complete? – Earned Value (EV) – Also known as Budgeted Cost of Work Performed (BCWP)
  • For the completed work how much did we spend? – Actual Cost (AC) – Actual Cost of Work Performed (ACWP)
2. Variance Analysis

Once we have the basic values of Planned Value (PV), which is also known as Budgeted Cost Of Work Scheduled (BCWS), Earned Value (EV), which is also known as the Budgeted Cost Of Work Performed (BCWP) and the Actual Cost (AC), which is also known as the Actual Cost Of Work Performed (ACWP), it is time to do the performance analysis.

  • Schedule Variance (SV) = EV – PV
  • Cost Variance (CV) = EV – AC
  • Schedule Performance Index (SPI) = EV/PV
  • Cost Performance Index (CPI) = EV/AC

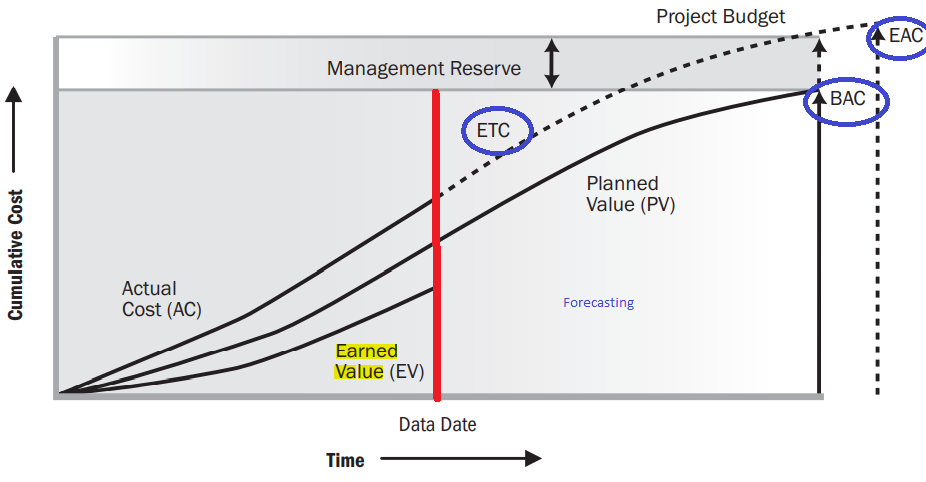
As we can see in the diagram above, as on the review date, the Earned Value (EV) is lower than the Planned Value (PV). That means, the work has not progressed as planned. The actual cost (AC) is higher than the Earned Value (EV) and even the Planned Value (PV). That means, there is a big cost overrun. In an ideal situation, all the three lines should have intersected at the Planned Value (PV). In that scenario EV = PV = AC

  • Schedule Variance (SV) = EV – PV = 0
  • Cost Variance (CV) = EV – AC = 0
  • Schedule Performance Index (SPI) = EV / PV = 1
  • Cost Performance Index (CPI) = EV / AC = 1
  • If the SPI=1, then we can infer that the project is progressing as per the agreed upon schedule.
  • If the SPI >1, then the project is progressing at a rate which is more than planned.
  • If the SPI <1, then the project is lagging behind schedule wise.
  • Similarly. If the Cost Performance Index (CPI)=1, then we can infer that the work is getting completed as per the budget.
  • If the CPI <1, then the that indicates budget overrun.
  • If the CPI>1, then more work is getting accomplished than planned, with the same amount of money.
  • As a general rule of thumb, if the SPI and CPI is 1 or above 1, then the project is doing well schedule wise and cost wise.

As project managers, if we know the schedule variance (SV), Cost Variance (CV), almost real time, then we can monitor and control our projects effectively.

3. Trend Analysis

The variance analysis provides us with the current snapshot of the project. One can become more pro-active in managing and controlling the project, if the future trends of the project performance can be predicted with the present progress information. We use graphs and charts to do this.

At this stage, let me introduce these three additional terminologies;

1) Budget At Completion (BAC) – is the total approved budget of the project from the beginning of the project till the end of the project.

2) Estimate to Complete (ETC) – is the budget required to complete the balance work of the project. ETC = (BAC – EV).

In some cases, ETC is calculated as a bottom up re-estimate for the balance activities to be completed.

3) Estimate at Completion (EAC)

  • If all the future work can be expected to be completed as planned, then how much will it cost when we complete the project. EAC = AC + ETC = AC + (BAC-EV).
  • If the current trend is going to continue in the future as well, then EAC = AC+(BAC-EV) / CPI.
  • In some projects, where the schedule has an impact on the cost, for example, a delay in schedule incurs additional cost, then EAC = AC + (BAC-EV) / (CPI x SPI). In this case, CPI and SPI are given weightages like (80/20, 50/50 or some other based on the judgment of the project team).
4. Reserve analysis

While performing the cost control of the project, the reserve analysis of the contingency and management reserves monitored. This will help in utilising these reserves elsewhere is the project progress is satisfactory or in organizing additional reserves proactively.

5. Corrective and Preventive actions based on the to Complete Performance Index (TCPI)

What should be the target CPI, to be maintained for the balance work, in order to complete the project within budget.

TCPI = Work remaining / Funds remaining

(BAC-EV) / (BAC–AC) or it can be,

(BAC-EV) / (EAC-AC) if the EAC is approved by the management.

Earned Value Management brings in more visibility into the project, and helps us to be more pro-active.

So far our focus was on forecasting the Estimate At Completion (EAC). What about forecasting the Estimated Date Of Completion of the project?. The following seven minutes video explains schedule forecasting;

Abrachan Pudussery, Domain expert, Wrench Solutions

Reference – Project Management Body Of Knowledge by PMI, USA