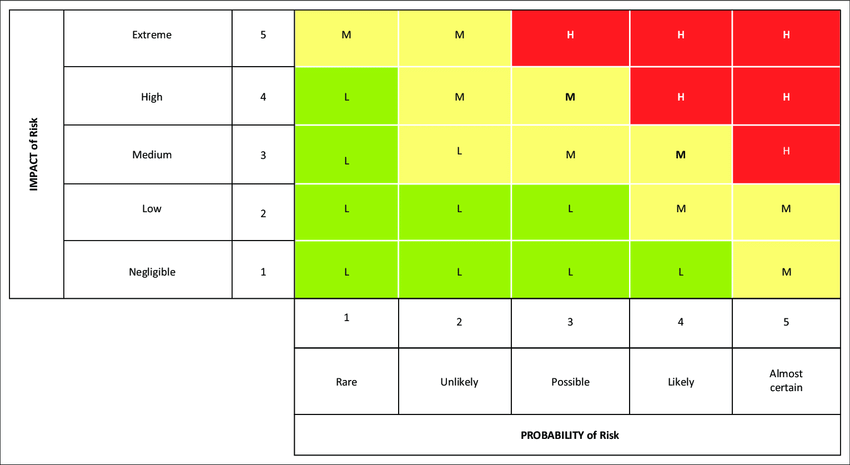
Probability and Impact matrix is used to segregate risks based on their probability and impact. In the probability and Impact matrix diagram shown below, the ‘X’ axis shows the probability scale and the ‘Y’ axis shows the Impact scale. Risks are categorized based on their PxI. The risks that fall under the ‘Red’ band must be addressed immediately. The ‘Yellow’ band can be under observation. The ‘Green’ band can be ignored for the time being. Widely used in project dashboards to monitor and control risks.