Information radiators

Monitoring and controlling Agile projects involves ongoing oversight, tracking, and adjustment of project activities to ensure that they stay on track and deliver value effectively. While Agile methodologies promote self-organizing teams and adaptive planning, monitoring and controlling are essential to maintain alignment with project goals, manage risks, and address issues as they arise. Here are some key practices for monitoring and controlling Agile projects:
- Regular Progress Tracking: Agile projects use various metrics and tools to track progress, such as burn-down charts, burn-up charts, velocity, and cumulative flow diagrams. These metrics provide visibility into the team’s progress, help identify potential bottlenecks or issues, and inform decision-making about resource allocation and scope management.
- Frequent Inspections and Adaptation: Agile projects emphasize frequent inspections and adaptation, allowing teams to regularly review their progress, adjust their plans, and make course corrections as needed. Iterative development cycles enable teams to incorporate feedback from stakeholders and adapt to changing requirements or priorities.
- Daily Stand-up Meetings: Daily Stand-up Meetings, also known as Daily Scrums, provide an opportunity for team members to synchronize their activities, discuss progress, and identify any impediments or blockers. These short, focused meetings help keep the team aligned and facilitate early identification and resolution of issues.
- Sprint Reviews: Sprint Reviews are held at the end of each Sprint to review the increment of work completed and gather feedback from stakeholders. These meetings allow the team to demonstrate the product increment, solicit feedback, and make adjustments based on stakeholder input.
- Sprint Retrospectives: Sprint Retrospectives are conducted at the end of each Sprint to reflect on the team’s processes and practices, identify areas for improvement, and make adjustments for future Sprints. Retrospectives promote a culture of continuous improvement and learning within the team.
- Risk Management: Agile projects employ risk management practices to identify, assess, and mitigate risks that may impact project success. Risk management techniques such as risk identification workshops, risk analysis, and risk prioritization help teams proactively manage risks and avoid potential issues.
- Product Backlog Refinement: Agile teams regularly refine the Product Backlog to ensure that it reflects the latest priorities, requirements, and feedback from stakeholders. Product Backlog refinement sessions involve reviewing and prioritizing backlog items, clarifying requirements, and estimating effort to support Sprint Planning and execution.
- Continuous Communication: Effective communication is essential for monitoring and controlling Agile projects. Teams maintain open and transparent communication channels with stakeholders, share progress updates, discuss issues and concerns, and collaborate on decision-making to ensure alignment and accountability.
By employing these monitoring and controlling practices, Agile projects can stay responsive to changing circumstances, deliver value incrementally, and achieve successful outcomes in dynamic and complex environments.
Sprint burndown chart
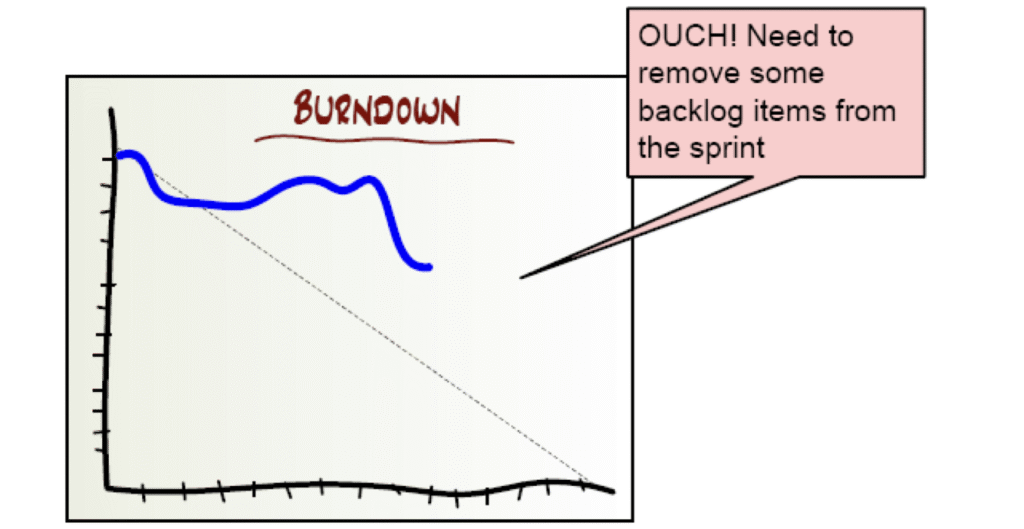
A Sprint Burndown Chart is a visual representation of the work completed versus the work remaining in a Sprint over time. It provides a snapshot of the progress made by the Scrum Team during the Sprint and helps track whether the team is on track to complete all planned work by the end of the Sprint. Here’s how a Sprint Burndown Chart works:
- X-axis (Horizontal Axis): The x-axis represents time, typically divided into days or increments of time within the duration of the Sprint. Each day of the Sprint is plotted along the x-axis, starting from the beginning of the Sprint and ending at the Sprint Review.
- Y-axis (Vertical Axis): The y-axis represents the amount of work remaining to be completed in the Sprint, usually measured in story points, tasks, or other units of work. The total work remaining is plotted along the y-axis.
- Ideal Burndown Line: The ideal burndown line is a diagonal line that represents the ideal progress of the Sprint, assuming a consistent rate of work completion throughout the Sprint. It connects the total amount of work remaining at the start of the Sprint with zero work remaining at the end of the Sprint.
- Actual Burndown Line: The actual burndown line represents the actual progress made by the team during the Sprint. It tracks the daily progress of the team in completing work, with data points plotted for each day of the Sprint.
Overall, Sprint Burndown Charts provide valuable insights into the progress of the Sprint, help identify potential issues early, and enable the Scrum Team to make informed decisions to optimize their performance and achieve their Sprint goals.
Burnup charts

A Sprint Burnup Chart is a visual representation of the work completed versus the work planned for a Sprint over time. Unlike a Sprint Burndown Chart, which tracks the remaining work, a Sprint Burnup Chart tracks both the completed work and the total work planned for the Sprint. Here’s how a Sprint Burnup Chart works:
- X-axis (Horizontal Axis): The x-axis represents time, typically divided into days or increments of time within the duration of the Sprint. Each day of the Sprint is plotted along the x-axis, starting from the beginning of the Sprint and ending at the Sprint Review.
- Y-axis (Vertical Axis): The y-axis represents the amount of work completed or planned for the Sprint, usually measured in story points, tasks, or other units of work. It shows the total work planned (scope) for the Sprint and the work completed over time.
- Scope Line: The scope line represents the total amount of work planned for the Sprint. It is a diagonal line that starts from zero work completed at the beginning of the Sprint and extends upward to the total work planned for the Sprint.
- Actual Work Completed Line: The actual work completed line represents the actual progress made by the team during the Sprint. It tracks the cumulative amount of work completed over time, with data points plotted for each day of the Sprint.
Overall, Sprint Burnup Charts provide valuable insights into the progress of the Sprint, help identify potential issues early, and enable the Scrum Team to make informed decisions to achieve their Sprint goals. They complement Sprint Burndown Charts by providing a broader perspective on the overall progress of the Sprint and the total work planned versus completed.
Cumulative flow diagrams

Cumulative Flow Diagrams (CFDs) are visual representations that illustrate the flow of work items through different stages of a process over time. They are commonly used in Agile and Lean methodologies to provide insight into the status of work items, identify bottlenecks, and track the overall flow of work in a project or workflow. Here’s how a Cumulative Flow Diagram works:
- X-axis (Horizontal Axis): The x-axis represents time, typically divided into increments such as days, weeks, or iterations. Each point along the x-axis corresponds to a specific point in time, starting from the beginning of the project or workflow and extending to the present.
- Y-axis (Vertical Axis): The y-axis represents the cumulative number of work items at each stage of the process. It shows the total count of work items in each stage, accumulated over time.
- Stages of the Process: The CFD includes separate lines or areas representing different stages or states of the process. These stages may vary depending on the specific workflow or project, but common examples include backlog, analysis, development, testing, and done.
- Flow of Work Items: The CFD visualizes the flow of work items through the different stages of the process over time. Work items enter the process through the backlog or intake stage and move through each stage until they are completed and marked as done.
- Cumulative Counts: At any point in time, the CFD shows the cumulative count of work items in each stage of the process. As work items move through the process, the lines representing each stage of the process increase or decrease in height, reflecting changes in the number of work items at each stage.
- Bottlenecks and Trends: By analyzing the CFD, stakeholders can identify bottlenecks, inefficiencies, and trends in the workflow. Bottlenecks are indicated by areas where lines representing certain stages of the process become wider or taller, indicating a buildup of work items and potential delays in those stages.
- Cycle Time and Throughput: CFDs can also provide insights into cycle time (the time it takes for work items to move through the process) and throughput (the rate at which work items are completed). By analyzing the slope and shape of the lines representing each stage of the process, stakeholders can assess the efficiency and effectiveness of the workflow.
Earned Value Management in Agile
Earned Value Management (EVM) is a project management technique used to measure project performance and progress by integrating scope, schedule, and cost metrics. While traditionally associated with traditional project management methodologies like Waterfall, EVM can also be adapted for use in Agile projects to provide insights into project health and performance.
Overall, while traditional EVM techniques may need to be adapted to fit the iterative and incremental nature of Agile projects, Earned Value Management can still be a valuable tool for measuring and managing project performance in Agile environments. It provides stakeholders with objective insights into project health and progress, enabling them to make informed decisions and drive successful project outcomes.