Scatter diagram, also known as the scatter plot, X-Y graph is one of the seven quality control tools.
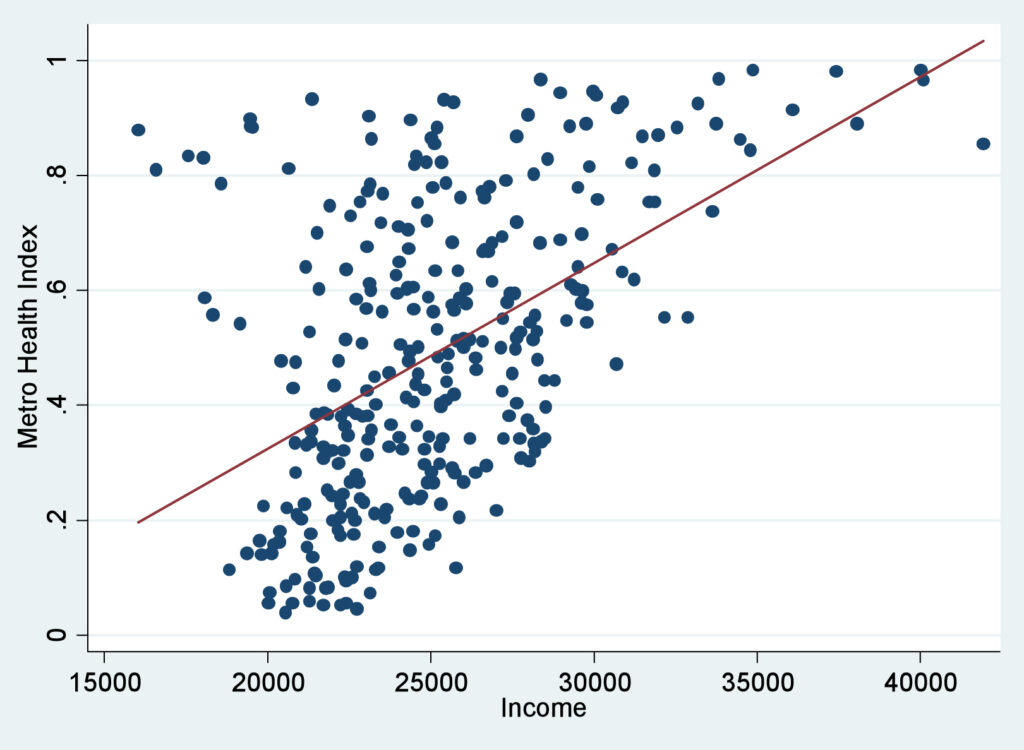
The scatter diagram graphs pairs of numerical data, with one variable on each axis, to look for a relationship between them. If the variables are correlated, the points will fall along a line or curve. The better the correlation, the tighter the points will hug the line. This cause analysis tool is considered one of the seven basic quality tools.