During the last two decades Agile Project Management (APM) has matured in the Information technology projects. Now the time has come for other project disciplines to embrace the agile best practices to work efficiently remotely, which has become the norm of the day. Below are the benefits reported by the early adopters of agile in EPC projects;
Increased communication between members of the project team, as well as between the project team and relevant stakeholders.
The visibility and ability to follow what the team is doing is at a whole other level
The transparency to others outside the team is close to perfect
People only work on tasks that are on the task list, and these are in a prioritized order
When stakeholders see what tasks are on the task list and what priority their task has in relation to other tasks, they become more patient with waiting for their task to be finished
Builds better relations between the team and their internal customers
With the opportunity to bring forth problems in daily meetings, the transparency has increased a lot
Problems surface quite quickly, allowing them to be solved faster
The problems are often identified by the team
When a problem is brought to the team’s knowledge during the daily meetings, others can immediately help with the problem
If a change is in conflict with another change it can be spotted as soon as possible
If a problem then surfaces it is easy to find , since only one day’s work has to be gone through to find the problem and people still remember well what they have done during the day
A project can last for 1.5 years and previously feedback wasn’t gathered into a final report until the end of the project. This feedback could then be utilized to improve future projects. Today thanks to Scrum this cycle is much faster and they ask for and discuss feedback continuously
Process improvement activities have become part of the project
Unified the ways of working
Business development efforts are also accounted
Quick introduction to Agile Project Management (APM)
Agile is a family of frameworks like;
Scrum
XP
RUP
Test Driven Development (TDD)
Scaled Agile
Kan-ban etc
Of these ‘Scrum’ and ‘Kan-ban’ are the most popular ones and are domain independent, hence adoption to EPC projects is easier.
At the center of all agile frameworks is the iteration, which is a time box, with a maximum duration of 30 days. The team can decide on the duration of the iteration with the only stipulation that iteration duration cannot be more than 30 days. At the beginning of every iteration the multi-disciplinary team decides the work they will perform during the iteration, and then they go ahead and perform the work. Every day, the team conducts a ‘daily stand up’ meeting with a maximum duration of 20 minutes, where each team member get approximately 2 minutes to communicate three things (What did I do yesterday?, What am I doing today?, and what are the issues I am facing and need help to resolve). At the end of the iteration there is a formal review of the output of the iteration followed by a retrospective meeting to capture the lessons learned during the iteration.
Let us take a detailed view of the scrum framework.
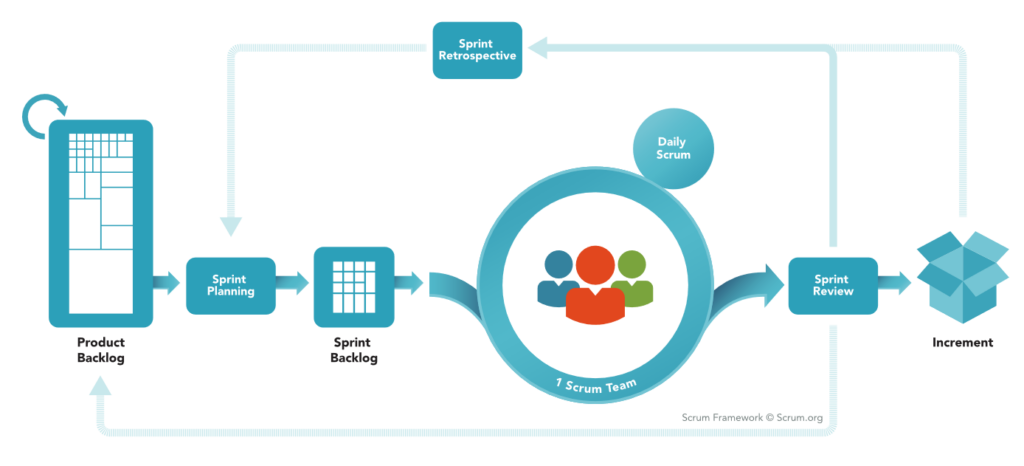
Overview of Scrum framework
The Scrum framework was established by Ken Schwaber and Jeff Sutherland in the year 1993. This is a very simple framework based on the scrum values of;
Is the pending task list towards a major milestone. When the product backlog gets exhausted, that is an indication that the associated milestone is about to get accomplished.
Sprint (Iteration) backlog
The scrum project progresses in sprints (iterations). Sprint is a time box not exceeding 30 days. Before the start of the sprint, the team sits together and decides what all things they can commit during the next sprint (time box). Once they agree on a set of tasks to be completed during the sprint, they prepare detailed plan for the sprint. The output of the sprint planning meeting is the sprint backlog which comprises of tasks and responsibilities.
Sprinting
During the sprint, the team carryout the work related to the sprint.
Daily stand-up meeting
Daily stand up meetings are 20 minute meetings (for 10 member teams) where each person explains three things to the rest of the team like;
What did I do yesterday?
What am I doing today?
What are the issues I am facing and need help?
This helps the team to see the status of the sprint on a daily basis. This also increases collaboration among team members to resolve issues quickly.
Sprint review
On the last day of the sprint, the team along with other key stakeholders review the status of the output of the sprint. If all the planned activities are completed with the required quality, the sprint is considered as successful.
Sprint retrospective
After the Sprint review, sprint retrospectives are conducted. The lessons learned during the sprint are consolidated and incorporated into the subsequent sprint’s planning meeting.
Sprint board
Is tracking board where tasks are classified into ‘To be done’, ‘Being done’ and ‘Done’. Based on the progress made the tasks are moved across these columns. The sprint board provides absolute clarity about who is working on which task and the status of every task to the project’s stakeholders.
Burn down charts
The ‘X’ axis of the burn down chart always represent the duration of the iteration (sprint). The ‘Y’ axis represents either the number of tasks to be completed, or the equivalent cumulative value (size, effort) of the tasks to be completed. The cumulative value on the ‘Y’ axis is updated on a daily basis based on the actual progress made.
KanBan
Kanban is a sprint without start date and end date. That represents continuous flow with thresholds defined for every stage of the work. This works based on a pull system based on ‘Stop starting things, Start finishing things’.
As you can see scrum is simple to understand. All the ceremonies of scrum together creates the necessary peer pressure, discipline, transparency resulting in optimal productivity of the remote teams.
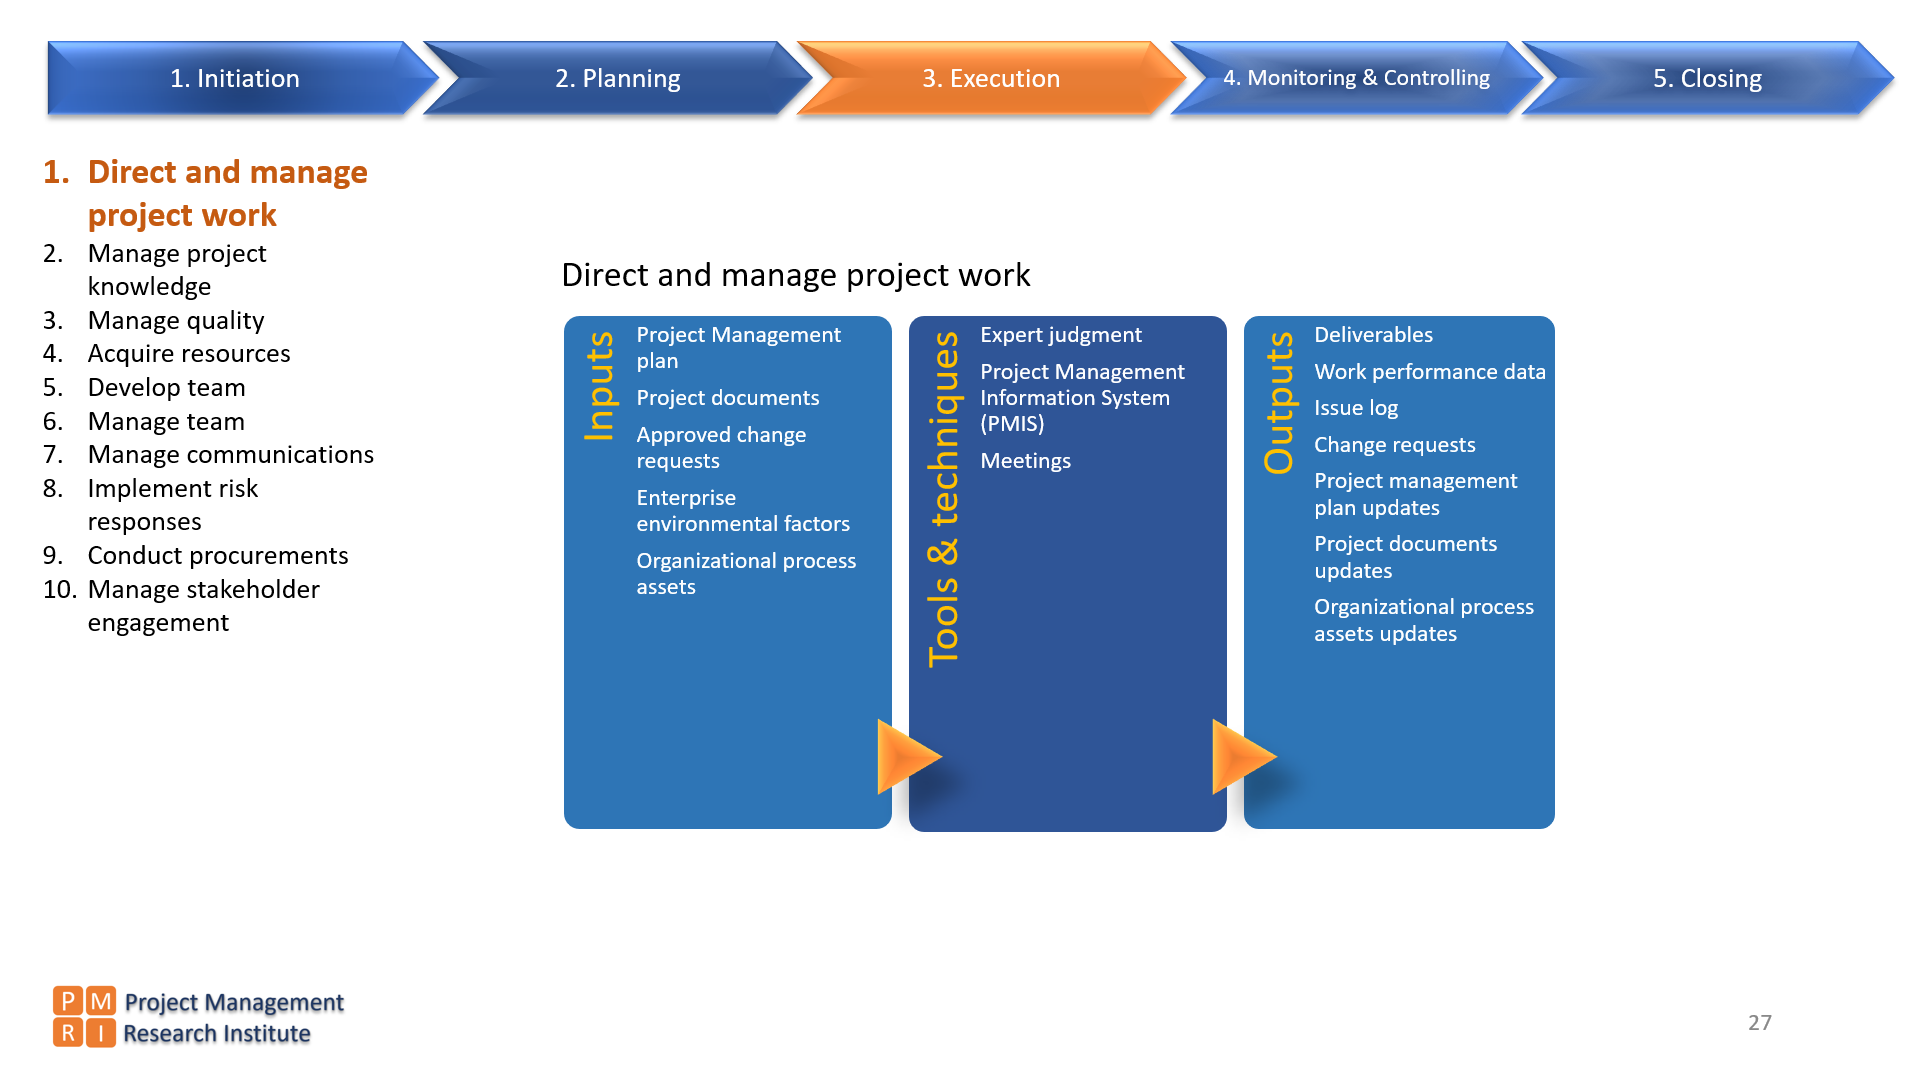
Opportunities to apply agile best practices within EPC projects
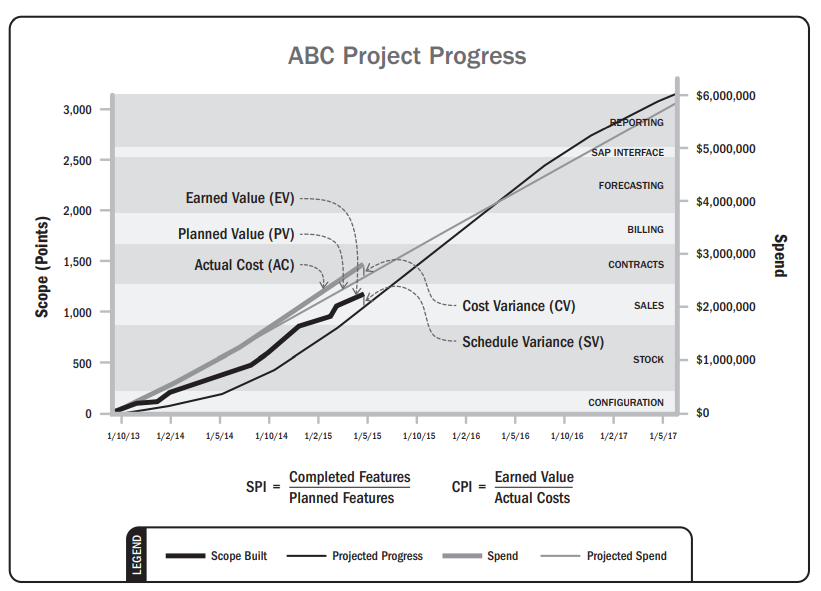
Defining rules of credit during the contracting / planning stages is one of the most important steps for effective monitoring and controlling based on ‘S’ curves and Earned Value Management. Without proper definition of rules of credit measuring planned value of work and earned value of work is not possible.
Rules of credit are used to measure the progress of work completed against the planned work. The most commonly used rules of credit are;
0/100 – Work is considered as earned (completed) when it is 100% completed.
50/50 – 50% of the work is considered as earned as soon as the work starts. The remaining 50% will be considered as earned only when the remaining 50% is fully completed.
25/75 – 25% of the work is considered as earned as soon as the work starts. The remaining 75% is considered as completed only when 100% of the work is completed.
20/80 – 20% of the work is considered as earned as soon as the work starts. The remaining 80% is considered as completed only when 100% of the work is completed.
When none is defined, we apply % completed based on actual measurement or expert judgment.
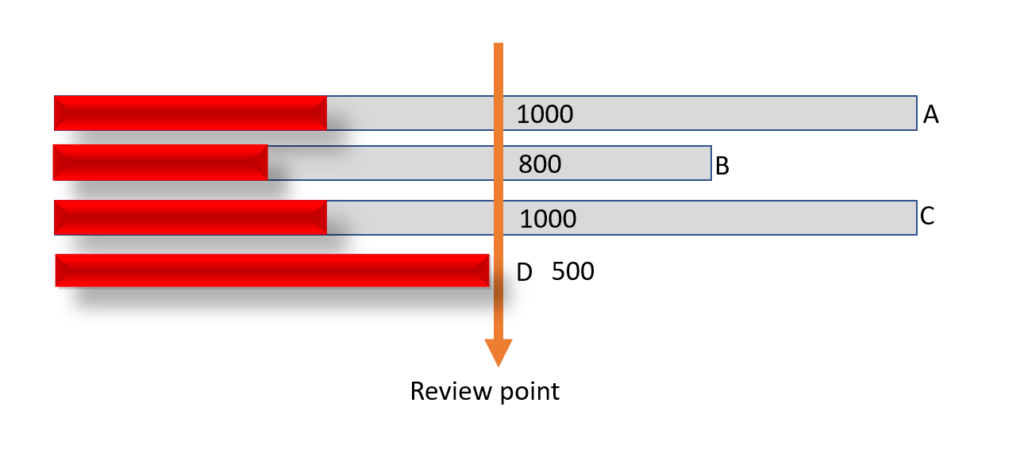
Rules of Credit – Examples
Let us see how the progress is reported based on the various rules of credits discussed above. The orange arrow indicates the review point.
0-100
Activity
Earned Value
A
0
B
0
C
0
D
500
Total
500
50-50
Activity
Earned Value
A
500
B
400
C
500
D
500
Total
1900
Summary
Defining rules of credit at the activity level during project planning is key to progress monitoring and control. This helps to roll up the project progress information in the activity, work package, milestone, project sequence. The commonly used rules of credit are 0/100, 50/50, 25/75, 20/80 and percentage completion based on actual progress made.
Successful projects deliver the scope of work with quality, within the agreed upon time and cost. This universal definition of project success holds good across all popular project management frameworks and project management communities. Even though the definition of success is very clear, still many projects fail. Most of the time the reasons for failures are common across projects.
It does not take lot of effort to identify the appropriate project management best practices among the globally accepted project management frameworks like PMBOK, PRINCE2, TCM, Agile, Lean and Others, which can solve the causes leading to project failures. Here is the list of root causes leading to project failures and the corresponding best practices in italics.
Change in Organization’s priorities (Portfolio management)
Change in project objectives (Portfolio management, Stakeholder management))
“The problems are known and the solutions exist. Then why do we allow projects to fail due to the same good old reasons?“
A closer analysis of the root causes reveal that they are inter-connected in nature. Hence calls for an integrated project management best practices approach to solve the problems. For example;
Scope related best practices cannot be implemented unless and until Stakeholder management is in place.
Unless and until the scope related best practices are established, scheduling and estimation best practices cannot be rolled out.
Without Scope, Schedule and Cost baselines Monitoring & Controlling becomes ineffective, Change management process will loose it’s purpose. These are a few examples.
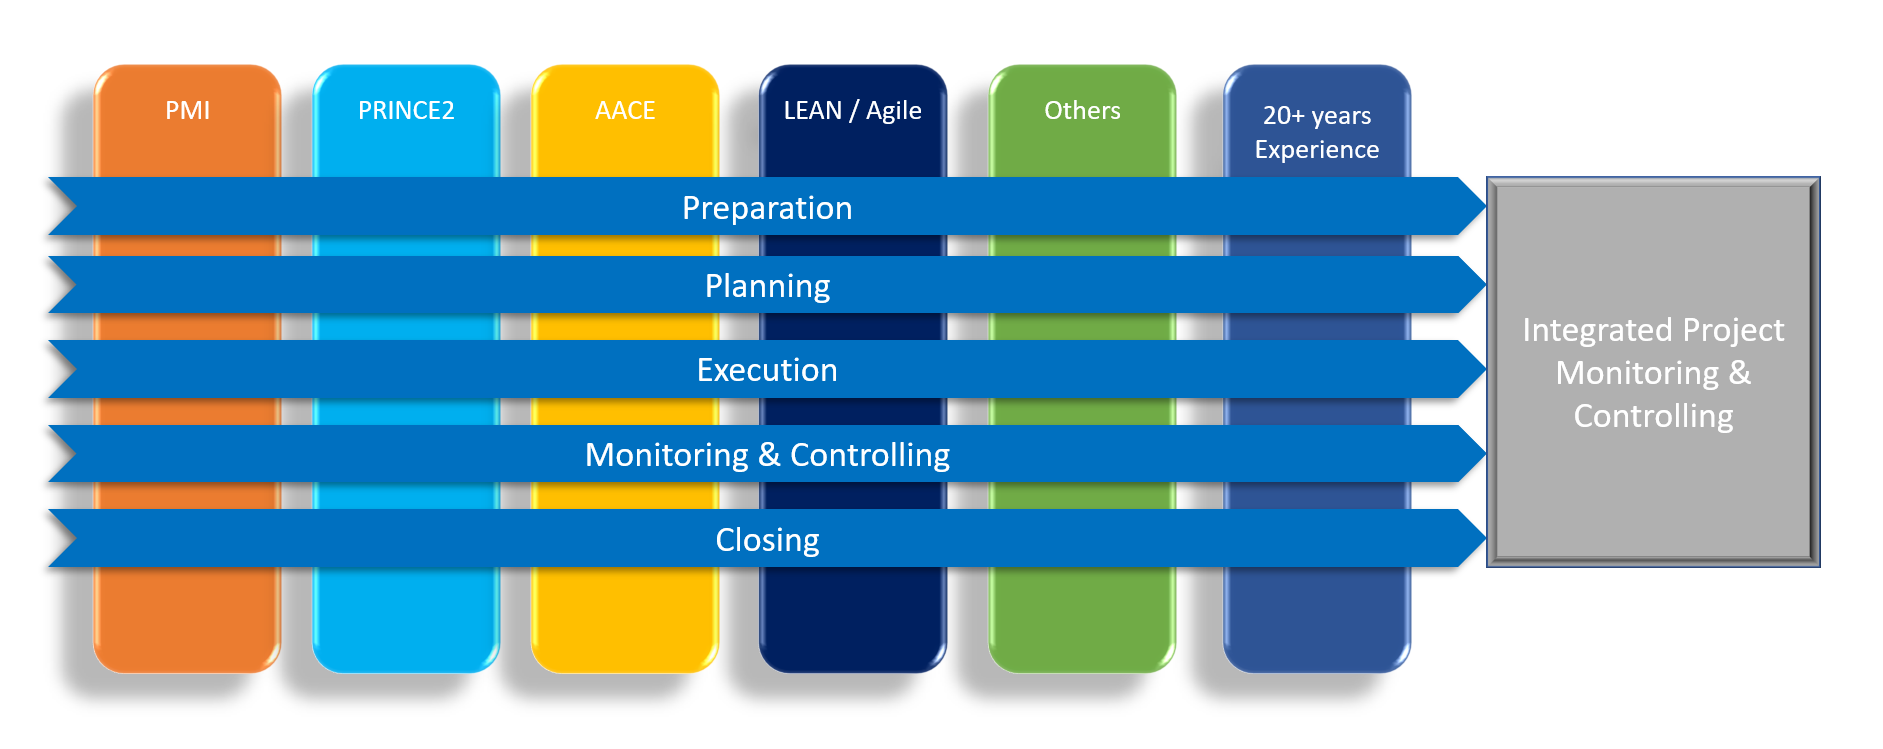
Integrated Project Monitoring & Control
After detailed research of all the globally accepted project management best practices by PMI, AACE, PRINCE2, LEAN & Agile for more than two decades we architected the Integrated Best Practices Approach to Project Monitoring & Control which cuts across all the globally accepted project management best practices. In a nutshell, it is the best of the best project management best practices hand picked and fine tuned from a practitioner’s perspective to make projects successful. Applying this integrated approach will not only resolve the current project management issues but will also forecast problems before they occur thus saving money and time.
Architecture of the Integrated Best Practices approach to Project Monitoring & Control
Focus – Plan in a way to facilitate almost real time project progress monitoring & controlling and forecasting
Work Breakdown Structure definition (WBS)
Organization breakdown structure definition (OBS)
Establishing WBS-OBS linkages
Resource Breakdown Structure (RBS)
Estimation & Budgeting
Cost breakdown structure
Schedule development
Rules of credit
Interfaces with other systems
Plan communications
Quality planning
Risk planning
Contingency planning
Phase#3 Execution
Focus – Collect accurate and timely execution data. Control the dynamic incidents
Project execution data capture
Change control
Quality management
Risk control
Contingency management
Communication
Phase#4 Monitoring & Controlling
Focus : Provide almost real time project status information to key stakeholders.
Planned Value
Earned Value
Actual Cost
Variance analysis
Forecasting Schedule & Cost
Control schedule
Control costs
Forensic analysis
Control quality
Snag management
Risk monitoring
Phase#5 Closing
Focus : Learning, Asset transition
Formal closure
Asset transition
The implementation aspects
Due to size and complexity of the present day projects, implementing best practices manually is not feasible. One must leverage the existing technology options to harness the power of integration of the best practices in order to accomplish the potential benefits. Technology driven best practices adoption can provide almost real time project management information for timely decision making.
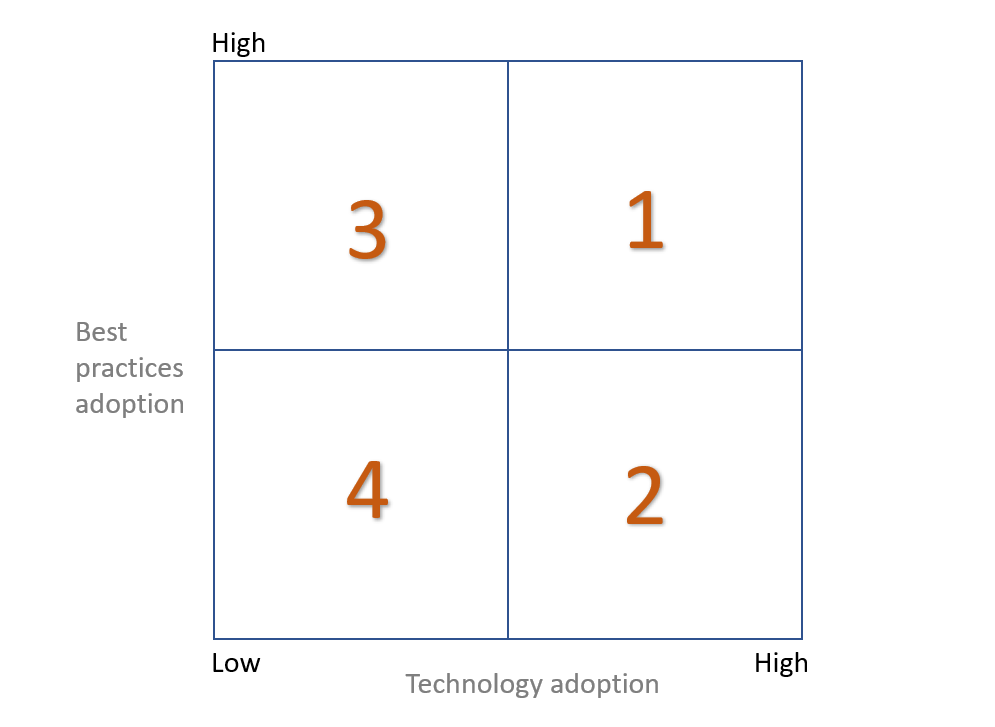
Best practices – Technology adoption quadrants
High best practices adoption with high technology adoption (desired)
Low best practices adoption with high technology adoption (sub-optimal performance)
High best practices adoption with low technology adoption (low productivity)
Low best practices adoption with high low technology adoption (danger zone)
High best practices adoption with high technology adoption is the way to go. Low best practices adoption with high technology adoption will provide some improvement which is sub-optimal. High best practices adoption with low technology adoption can slow down the organization. And finally, those in the low best practices adoption and low technology adoption zone are in the danger zone. Technology enabled best practices adoption is key to enhancing project success rates in highly competitive and complex environments.
Conclusion
Even though the projects are unique, the root causes of project failures are common and interconnected. Already existing project management best practices have solutions to address these problems. As the root causes of failures are inter linked, what is required is an integrated best practices approach to solve these problems. This approach along with the right technology adoption will help project management practitioners to increase their project success rate and profitability.