Dr. Kaoru Ishikawa, a Japanese quality control statistician, invented the Cause and effect diagram. Hence, It is often also referred to as the Ishikawa diagram. The cause and effect diagram diagram is an analysis tool that provides a systematic way of looking at effects and the causes that create or contribute to those effects. Because, the design of the diagram looks much like the skeleton of a fish it is also referred to as the fish bone diagram as well.
So, cause and effect diagram, Ishikawa diagram and Fish bone diagram are all same.
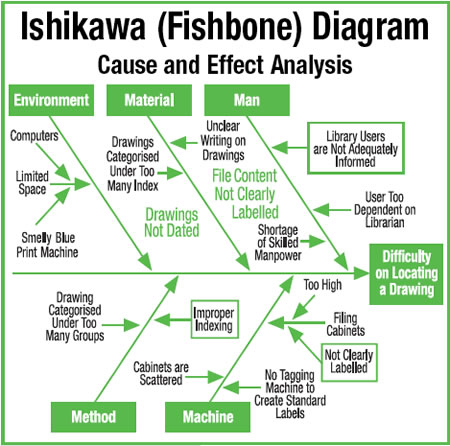
In the Cause and Effect diagram, the causes are grouped into;
- Man
- Machine
- Method
- Material
- Environment
Most of the causes can be fit into these five categories. Based on the context of usage, these categories can be tailored, if required.
A cause-and-effect diagram can help identify the reasons why a process goes out of control. Often the fish bone diagram can be used to summarize the results of a brainstorming session, identifying the causes of a specified undesirable outcome. It helps to identify root causes and ensures a common understanding of the causes.
Below is a fish bone diagram showing the probable causes leading to difficulty on locating a drawing.
Cause and effect diagrams are widely used to perform root cause analysis
Ishikawa diagrams are also known as Fish bone diagrams and Cause and effect diagrams.