Project Cost and Schedule forecasting

Schedule and Cost forecasting explained in detail.

  • Are we progressing as planned?
  • Are we completing the work within budget?
  • When will we complete the project?

These are the key questions we hear most of the time in project review meetings. Well implemented earned value management systems, provide answers to these questions at the press of a button.

Earned Value Management (EVM) is based on the analysis of the earned value of the project and comparing it with the planned value of the project. Earned value management is used to monitor and control both the schedule and cost. Earned value management (EVM) comprises of;

  1. Earned Value Analysis
  2. Variance Analysis
  3. Trend Analysis
  4. Reserve Analysis
  5. Corrective / Preventive actions
1. Earned Value Analysis :

The basic building blocks of earned value management are;

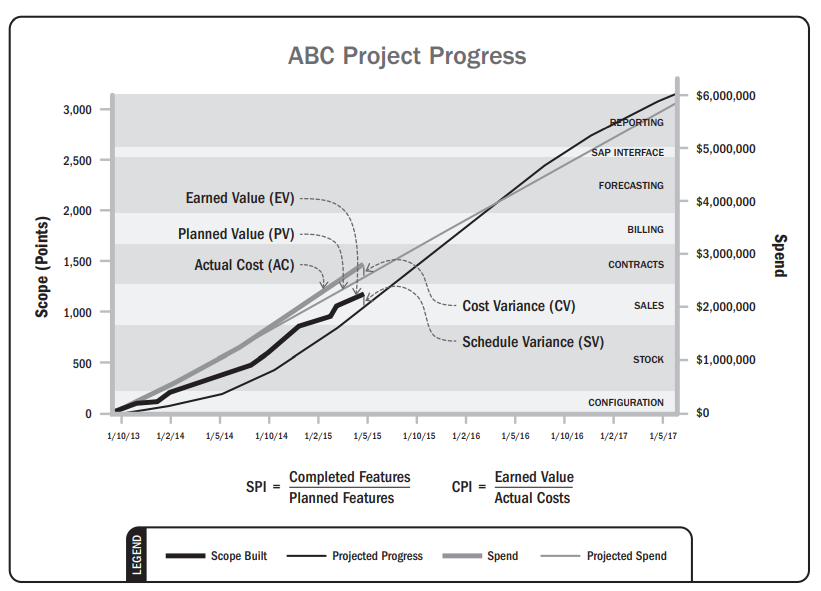
  • As on date, how much work we were supposed to complete? – Planned Value (PV)  – Also known as Budgeted Cost of Work Scheduled (BCWS) 
  • Out of that how much work did we complete? – Earned Value (EV) – Also known as Budgeted Cost of Work Performed (BCWP)
  • For the completed work how much did we spend? – Actual Cost (AC) – Actual Cost of Work Performed (ACWP)
2. Variance Analysis

Once we have the basic values of Planned Value (PV), which is also known as Budgeted Cost Of Work Scheduled (BCWS), Earned Value (EV), which is also known as the Budgeted Cost Of Work Performed (BCWP) and the Actual Cost (AC), which is also known as the Actual Cost Of Work Performed (ACWP), it is time to do the performance analysis.

  • Schedule Variance (SV) = EV – PV
  • Cost Variance (CV) = EV – AC
  • Schedule Performance Index (SPI) = EV/PV
  • Cost Performance Index (CPI) = EV/AC

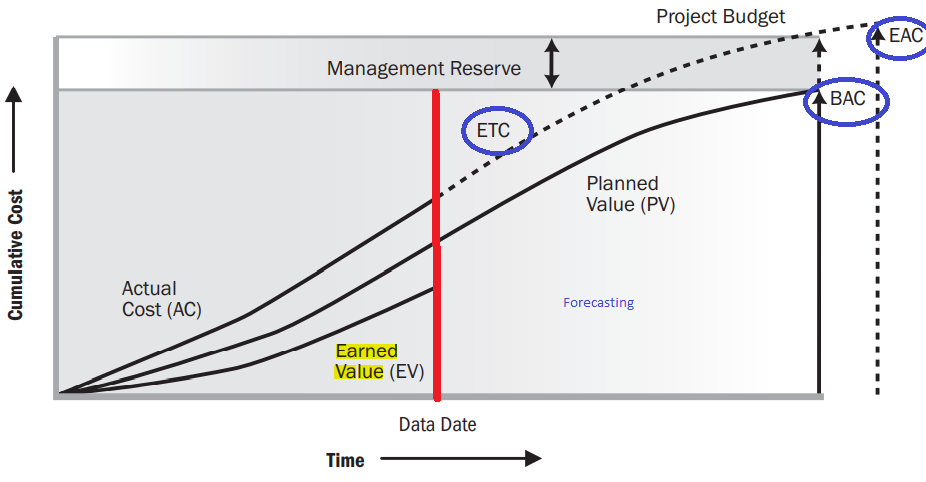
As we can see in the diagram above, as on the review date, the Earned Value (EV) is lower than the Planned Value (PV). That means, the work has not progressed as planned. The actual cost (AC) is higher than the Earned Value (EV) and even the Planned Value (PV). That means, there is a big cost overrun. In an ideal situation, all the three lines should have intersected at the Planned Value (PV). In that scenario EV = PV = AC

  • Schedule Variance (SV) = EV – PV = 0
  • Cost Variance (CV) = EV – AC = 0
  • Schedule Performance Index (SPI) = EV / PV = 1
  • Cost Performance Index (CPI) = EV / AC = 1
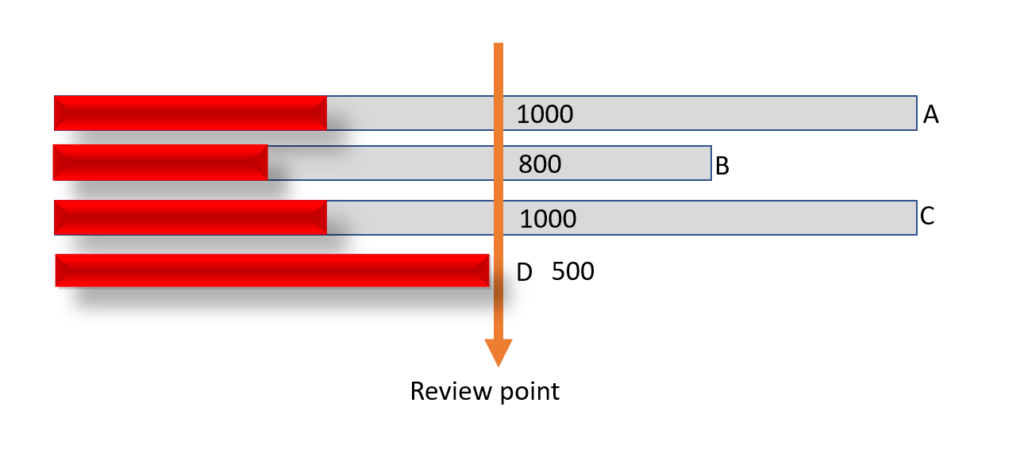
  • If the SPI=1, then we can infer that the project is progressing as per the agreed upon schedule.
  • If the SPI >1, then the project is progressing at a rate which is more than planned.
  • If the SPI <1, then the project is lagging behind schedule wise.
  • Similarly. If the Cost Performance Index (CPI)=1, then we can infer that the work is getting completed as per the budget.
  • If the CPI <1, then the that indicates budget overrun.
  • If the CPI>1, then more work is getting accomplished than planned, with the same amount of money.
  • As a general rule of thumb, if the SPI and CPI is 1 or above 1, then the project is doing well schedule wise and cost wise.

As project managers, if we know the schedule variance (SV), Cost Variance (CV), almost real time, then we can monitor and control our projects effectively.

3. Trend Analysis

The variance analysis provides us with the current snapshot of the project. One can become more pro-active in managing and controlling the project, if the future trends of the project performance can be predicted with the present progress information. We use graphs and charts to do this.

At this stage, let me introduce these three additional terminologies;

1) Budget At Completion (BAC) – is the total approved budget of the project from the beginning of the project till the end of the project.

2) Estimate to Complete (ETC) – is the budget required to complete the balance work of the project. ETC = (BAC – EV).

In some cases, ETC is calculated as a bottom up re-estimate for the balance activities to be completed.

3) Estimate at Completion (EAC)

  • If all the future work can be expected to be completed as planned, then how much will it cost when we complete the project. EAC = AC + ETC = AC + (BAC-EV).
  • If the current trend is going to continue in the future as well, then EAC = AC+(BAC-EV) / CPI.
  • In some projects, where the schedule has an impact on the cost, for example, a delay in schedule incurs additional cost, then EAC = AC + (BAC-EV) / (CPI x SPI). In this case, CPI and SPI are given weightages like (80/20, 50/50 or some other based on the judgment of the project team).
4. Reserve analysis

While performing the cost control of the project, the reserve analysis of the contingency and management reserves monitored. This will help in utilising these reserves elsewhere is the project progress is satisfactory or in organizing additional reserves proactively.

5. Corrective and Preventive actions based on the to Complete Performance Index (TCPI)

What should be the target CPI, to be maintained for the balance work, in order to complete the project within budget.

TCPI = Work remaining / Funds remaining

(BAC-EV) / (BAC–AC) or it can be,

(BAC-EV) / (EAC-AC) if the EAC is approved by the management.

Earned Value Management brings in more visibility into the project, and helps us to be more pro-active.

So far our focus was on forecasting the Estimate At Completion (EAC). What about forecasting the Estimated Date Of Completion of the project?. The following seven minutes video explains schedule forecasting;

Abrachan Pudussery, Domain expert, Wrench Solutions

Reference – Project Management Body Of Knowledge by PMI, USA

Interpreting Sprint or Iteration burn-down charts

If you learn to interpret the iteration burn down charts or sprint burn down charts, then you have understood agile or scrum conceptually correct. This article will walk you through the iteration burn down chart of a sprint.

Day#1

The Iteration or Sprint starts with the Iteration planning meeting. The output of the iteration planning meeting are;

  • The list of features to be developed during the iteration
  • Estimated story points (feature points) for the features (Fibonacci series)
  • The activities that need to be performed and their effort estimates
  • The tracking board (kanban board) which has the columns for;
    • To be done
    • Being done
    • Done
  • Two types of the Iteration / Sprint burn down chart
    • One with cumulative effort required to complete the sprint on the ‘Y’ axis and the duration of the sprint on the ‘X’ axis. The balance effort required to complete the sprint gets updated on a daily basis. This is a re-estimate by the team on a daily basis (this is not planned effort – consumed effort). This type of iteration burn down charts with the effort required to complete the iteration on the ‘Y’ axis and the iteration duration on the ‘X’ axis will help teams to speed up when required.
    • Teams use Iteration burn down to monitor the story points completed against the story points planned within the iteration. In this case the ‘Y’ axis will have the total story points planned for the sprint. This will get decreased based on the actual story points completed. This type of iteration burn down charts help the project stakeholders, especially the product owner to monitor and control the story points planned Vs achieved within the iteration.

Sprint burn down – Immediately after the planning meeting

Sprint burn down after day#2 of the sprint

Sprint burn down after day#3 of the sprint

Sprint burn down after day#4 of the sprint

Digital and Agile PMO

PMOs are evolving at a faster pace than anticipated. The traditional PMO’s started by providing project delivery support. Soon PMOs became strategic in nature by extending their support to enterprise portfolio management. This was followed by the digital PMO and the Agile PMO.

The future is of ‘Digitally agile PMOs’, which will help the project managers and other key stakeholders to be more agile and predictive at the same time. Facilitating the adoption of agility along with the predictability of the predictive project management.

Here is a mind map on the evolution of PMOs through traditional, strategic, digital and agile to ‘Digitally agile PMO’

Evolution of the PMO

Characteristics of digitally agile PMO

  • Multi disciplinary – They are multi disciplinary. They must be able to support projects in all the aspects of project management covering;
    • Scope
    • Schedule
    • Cost
    • Resources
    • Procurement
    • Communications
    • Stakeholders
    • Quality
    • Risks
    • Integration
  • Value driven – Their primary focus is to maximize the value delivered to the customer in the shortest possible time. They must also enforce a minimum set of ground rules to facilitate effective collaboration.
  • Agile metrics – Apart from the traditional metrics, they focus on the agile metrics. Most of the predictive project management metrics and measurements are focused on the past performance like schedule variance, cost variance etc, where as the agile metrics combine both past and future indicators.
  • Balance flexibility & stability – While scope is flexible, other parameters like time buckets, rules of credit, definition of done (acceptance criteria) must remain non-negotiable and must be uniform across projects.
  • Quick response to changes – As agile projects welcome changes even late in the project, agile PMOs should also align to this character of agile projects.
  • Flexible reporting tools
    • Iteration burn downs
    • Release burn downs
    • Product burn downs
    • EVM for agile
    • Cumulative flow diagrams
    • Schedule forecasts
    • Cost forecasts
  • Multi device
    • Any device
    • Any time
    • Any relevant stakeholder
    • Integration of new and legacy platforms

Benefits from a ‘digitally agile’ approach to project management

Scenario

  • Project with tight schedule with penalty clause
  • Multi cultural team with team members from USA and China
  • Concurrent engineering from 6 different locations

Strategy

  • Hybrid project management, mixing the best of both agile and predictive best practices. The long term planning was based on the predictive styles where as for execution the best practices of agile were used
  • Right selection of a project monitoring and control tool with the capability to;
    • Support both predictive and agile ways of working
    • Provide transparency and accuracy of project progress data to relevant stakeholders almost real time
    • Interface with legacy scheduling and document management systems
    • Roll up and roll down project status from multiple locations
    • Manage risks
    • Manage quality
    • Manage configuration management of engineering drawings
    • Collaborate across multiple teams

Benefits

  • Project got completed ahead of schedule
  • 85% improvement in project management efficiency
  • 75% less time in reporting
  • 100% quality achievement
  • 80% reduction in deliverable management time
  • Reduction in review cycle time from 7 days to 1 day

To know more contact us

Rules of Credit

Introduction

Defining rules of credit during the contracting / planning stages is one of the most important steps for effective monitoring and controlling based on ‘S’ curves and Earned Value Management. Without proper definition of rules of credit measuring planned value of work and earned value of work is not possible.

Rules of credit are used to measure the progress of work completed against the planned work. The most commonly used rules of credit are;

  • 0/100 – Work is considered as earned (completed) when it is 100% completed.
  • 50/50 – 50% of the work is considered as earned as soon as the work starts. The remaining 50% will be considered as earned only when the remaining 50% is fully completed.
  • 25/75 – 25% of the work is considered as earned as soon as the work starts. The remaining 75% is considered as completed only when 100% of the work is completed.
  • 20/80 – 20% of the work is considered as earned as soon as the work starts. The remaining 80% is considered as completed only when 100% of the work is completed.
  • When none is defined, we apply % completed based on actual measurement or expert judgment.

Rules of Credit – Examples

Let us see how the progress is reported based on the various rules of credits discussed above. The orange arrow indicates the review point.

0-100
ActivityEarned Value
A0
B0
C0
D500
Total500
50-50
ActivityEarned Value
A500
B400
C500
D500
Total1900

Summary

Defining rules of credit at the activity level during project planning is key to progress monitoring and control. This helps to roll up the project progress information in the activity, work package, milestone, project sequence. The commonly used rules of credit are 0/100, 50/50, 25/75, 20/80 and percentage completion based on actual progress made.

Read also

Digital PMO

PMP certification training

Integrated Project Monitoring & Control for EPC

Successful projects deliver the scope of work with quality, within the agreed upon time and cost. This universal definition of project success holds good across all popular project management frameworks and project management communities. Even though the definition of success is very clear, still many projects fail. Most of the time the reasons for failures are common across projects.

It does not take lot of effort to identify the appropriate project management best practices among the globally accepted project management frameworks like PMBOK, PRINCE2, TCM, Agile, Lean and Others, which can solve the causes leading to project failures. Here is the list of root causes leading to project failures and the corresponding best practices in italics.

  1. Change in Organization’s priorities (Portfolio management)
  2. Change in project objectives (Portfolio management, Stakeholder management))
  3. Inaccurate requirements gathering (Requirements collection and scope definition practices, Stakeholder management))
  4. Inadequate vision or goal for the project (Portfolio management, Project Chartering, Stakeholder management)
  5. Inadequate or poor communication (Communication planning, Stakeholder management))
  6. Lack of project progress information(Communication planning, Stakeholder management)
  7. Opportunities and risks were not defined (Risk management)
  8. Inaccurate cost estimates (Cost estimation and budgeting)
  9. Poor change management (Change management processes)
  10. Inadequate sponsor support (Project chartering, Stakeholder expectation management)
  11. Resource dependency (Resource planning)
  12. Inaccurate task time estimate (Activity Duration estimation)
  13. Inexperienced project manager (Project manager competencies and professional responsibilities)
  14. Limited / taxed resources (Resource planning, Resource leveling, Forecasting)
  15. Inadequate resource forecasting (Resource planning, Forecasting)
  16. Team member procrastination (Monitoring & Control)
  17. Task dependency (Scheduling, Monitoring & Controlling)

“The problems are known and the solutions exist. Then why do we allow projects to fail due to the same good old reasons?

A closer analysis of the root causes reveal that they are inter-connected in nature. Hence calls for an integrated project management best practices approach to solve the problems. For example;

  • Scope related best practices cannot be implemented unless and until Stakeholder management is in place.
  • Unless and until the scope related best practices are established, scheduling and estimation best practices cannot be rolled out.
  • Without Scope, Schedule and Cost baselines Monitoring & Controlling becomes ineffective, Change management process will loose it’s purpose. These are a few examples.

Integrated Project Monitoring & Control

After detailed research of all the globally accepted project management best practices by PMI, AACE, PRINCE2, LEAN & Agile for more than two decades we architected the Integrated Best Practices Approach to Project Monitoring & Control which cuts across all the globally accepted project management best practices. In a nutshell, it is the best of the best project management best practices hand picked and fine tuned from a practitioner’s perspective to make projects successful. Applying this integrated approach will not only resolve the current project management issues but will also forecast problems before they occur thus saving money and time.

Architecture of the Integrated Best Practices approach to Project Monitoring & Control

Courtesy SmartProject
Phase#1 Preparation

Focus – Get ready for the planning phase

  • Scope definition
  • Stakeholder identification
  • Role definition
  • High level risk definition
  • Information dissemination
Phase#2 Planning

Focus – Plan in a way to facilitate almost real time project progress monitoring & controlling and forecasting

  • Work Breakdown Structure definition (WBS)
  • Organization breakdown structure definition (OBS)
  • Establishing WBS-OBS linkages
  • Resource Breakdown Structure (RBS)
  • Estimation & Budgeting
  • Cost breakdown structure
  • Schedule development
  • Rules of credit
  • Interfaces with other systems
  • Plan communications
  • Quality planning
  • Risk planning
  • Contingency planning
Phase#3 Execution

Focus – Collect accurate and timely execution data. Control the dynamic incidents

  • Project execution data capture
  • Change control
  • Quality management
  • Risk control
  • Contingency management
  • Communication
Phase#4 Monitoring & Controlling

Focus : Provide almost real time project status information to key stakeholders.

  • Planned Value
  • Earned Value
  • Actual Cost
  • Variance analysis
  • Forecasting Schedule & Cost
  • Control schedule
  • Control costs
  • Forensic analysis
  • Control quality
  • Snag management
  • Risk monitoring
Phase#5 Closing

Focus : Learning, Asset transition

  • Formal closure
  • Asset transition

The implementation aspects

Due to size and complexity of the present day projects, implementing best practices manually is not feasible. One must leverage the existing technology options to harness the power of integration of the best practices in order to accomplish the potential benefits. Technology driven best practices adoption can provide almost real time project management information for timely decision making.

Best practices – Technology adoption quadrants

  1. High best practices adoption with high technology adoption (desired)
  2. Low best practices adoption with high technology adoption (sub-optimal performance)
  3. High best practices adoption with low technology adoption (low productivity)
  4. Low best practices adoption with high low technology adoption (danger zone)

High best practices adoption with high technology adoption is the way to go. Low best practices adoption with high technology adoption will provide some improvement which is sub-optimal. High best practices adoption with low technology adoption can slow down the organization. And finally, those in the low best practices adoption and low technology adoption zone are in the danger zone. Technology enabled best practices adoption is key to enhancing project success rates in highly competitive and complex environments.

Conclusion

Even though the projects are unique, the root causes of project failures are common and interconnected. Already existing project management best practices have solutions to address these problems. As the root causes of failures are inter linked, what is required is an integrated best practices approach to solve these problems. This approach along with the right technology adoption will help project management practitioners to increase their project success rate and profitability.

Join the upcoming webinar on Integrated Project Monitoring & Control for EPC Projects